> ## Documentation Index
> Fetch the complete documentation index at: https://dub-mintlify-dcaf408a.mintlify.site/llms.txt
> Use this file to discover all available pages before exploring further.
# Commission analytics
> Use commission analytics to understand how much your partners are earning over time and which commissions are driving your program payouts.
This feature is only available on [Business plans and
above](https://dub.co/pricing/partners).
Commission analytics helps you analyze your partner program's commission earnings over time. It is useful when you want to understand payout trends, compare commission activity across a date range, or see which partners and referral activity are driving earnings.
## Where to find commission analytics?
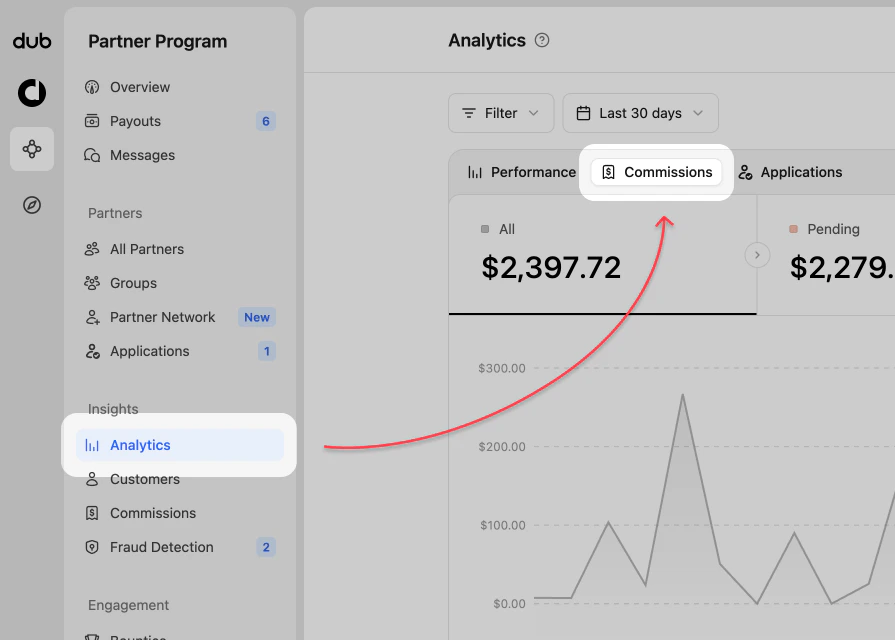
When viewing your Partner Program navigation, click on the **Analytics** page in the **Insights** group.
In the analytics chart, select **Commissions** from the top data selector.
 ## Commission analytics views
The commission analytics dashboard uses filtering and date range controls like the [program analytics](/help/article/program-analytics), but focuses the chart on commission earnings.
### 1. Commission chart
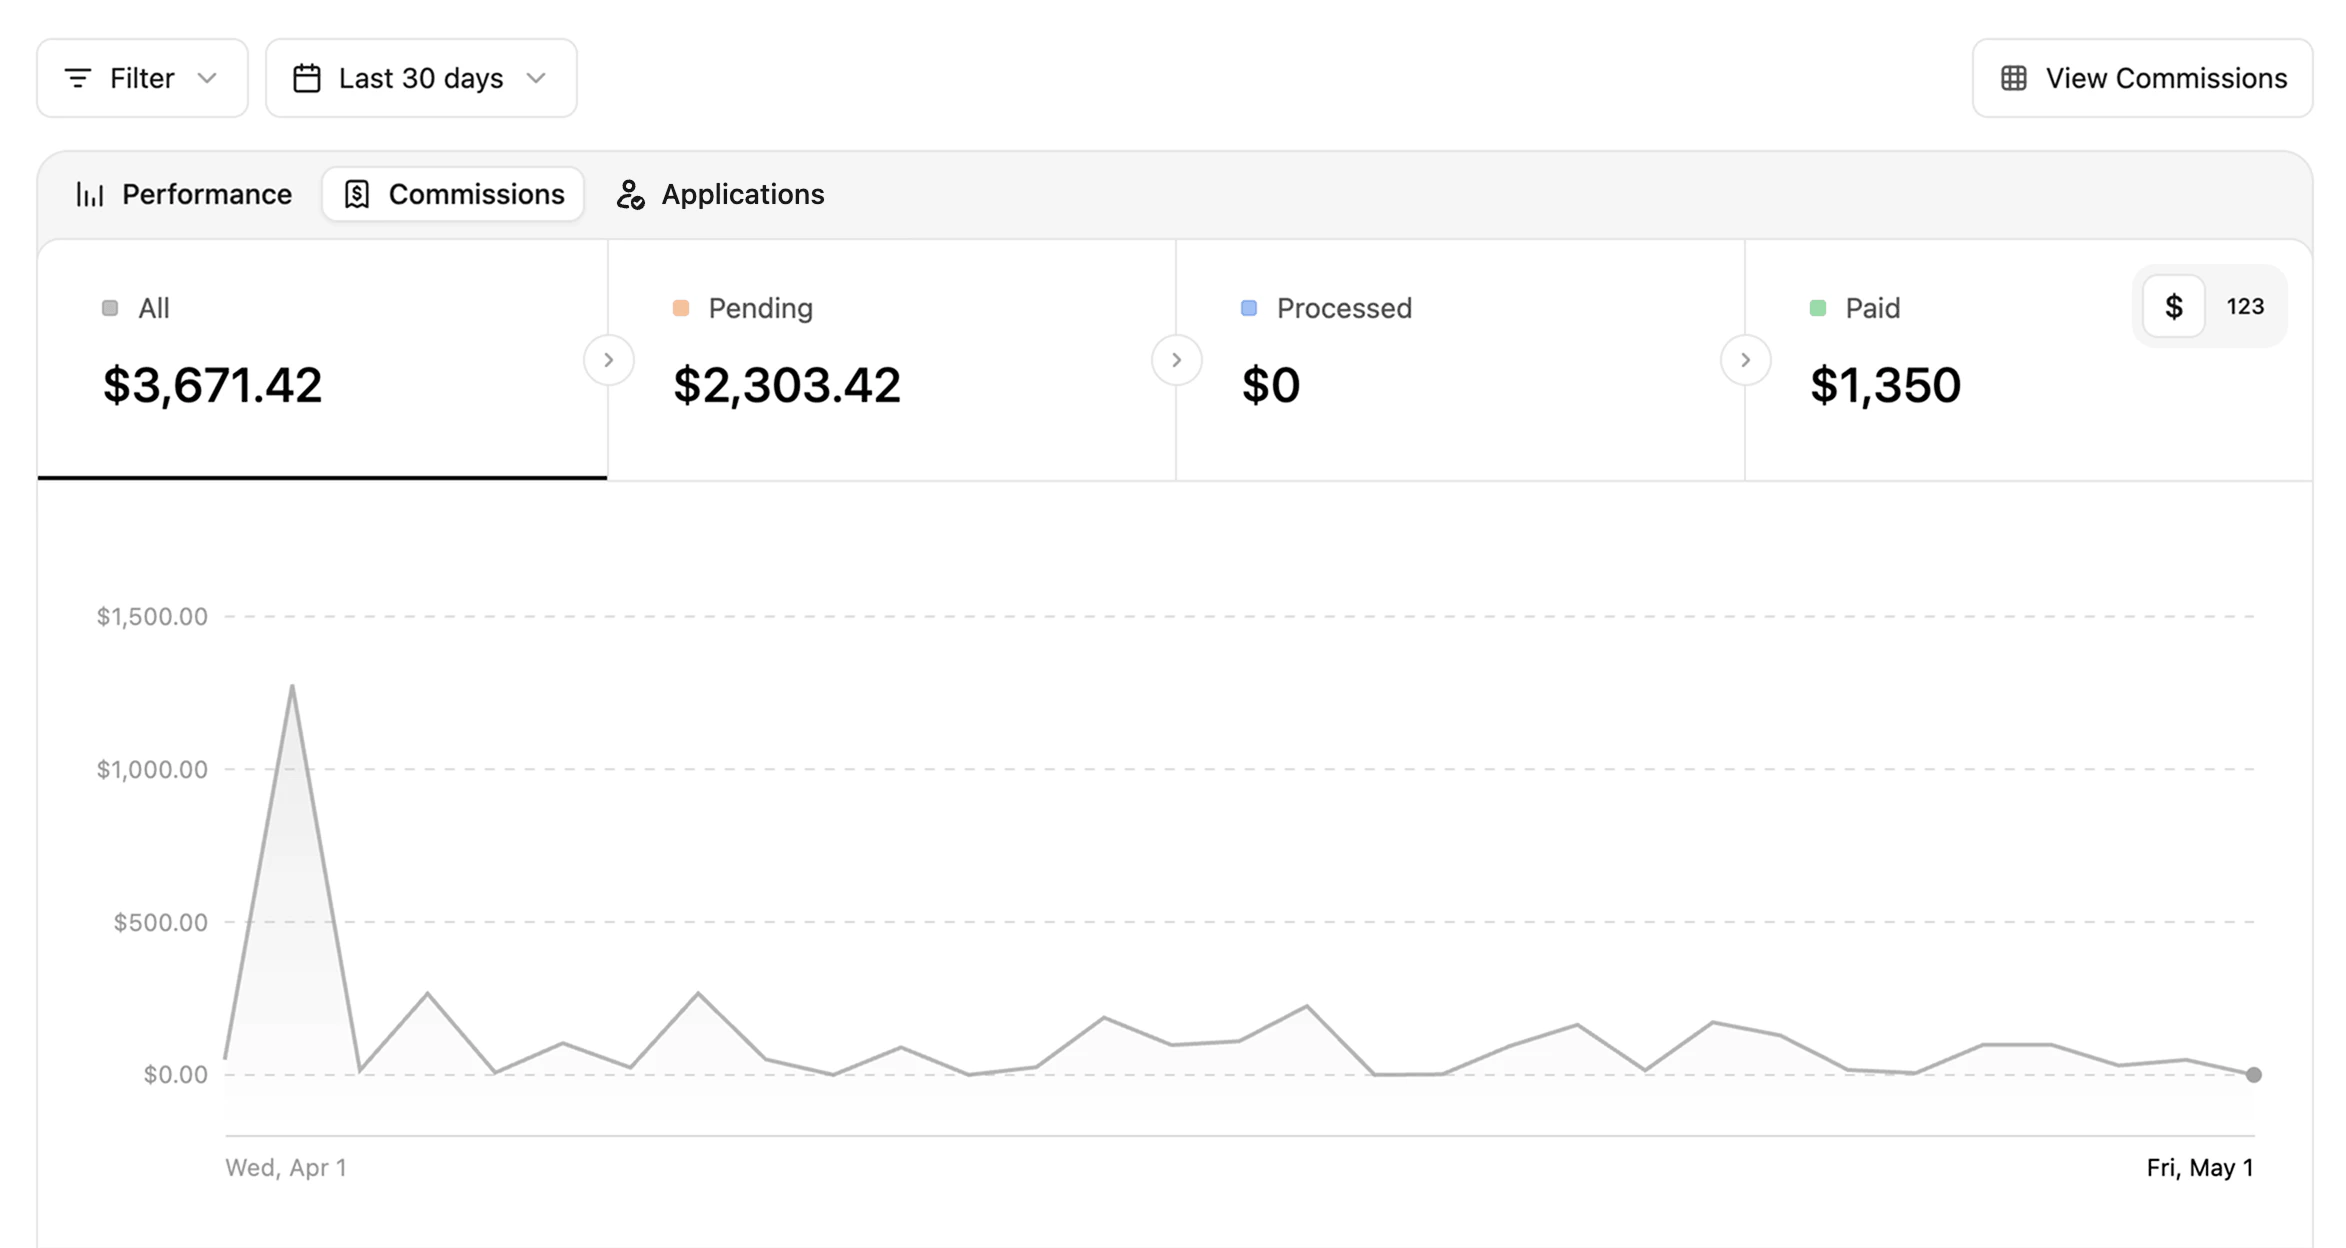
The commission chart shows commission earnings across the selected date range. You can use it to identify spikes, dips, and trends in partner payouts.
## Commission analytics views
The commission analytics dashboard uses filtering and date range controls like the [program analytics](/help/article/program-analytics), but focuses the chart on commission earnings.
### 1. Commission chart
The commission chart shows commission earnings across the selected date range. You can use it to identify spikes, dips, and trends in partner payouts.
 **Data toggle**
You can change the data displayed by clicking the `$ | 123` toggle in the top right of the data type section.
**Data toggle**
You can change the data displayed by clicking the `$ | 123` toggle in the top right of the data type section.
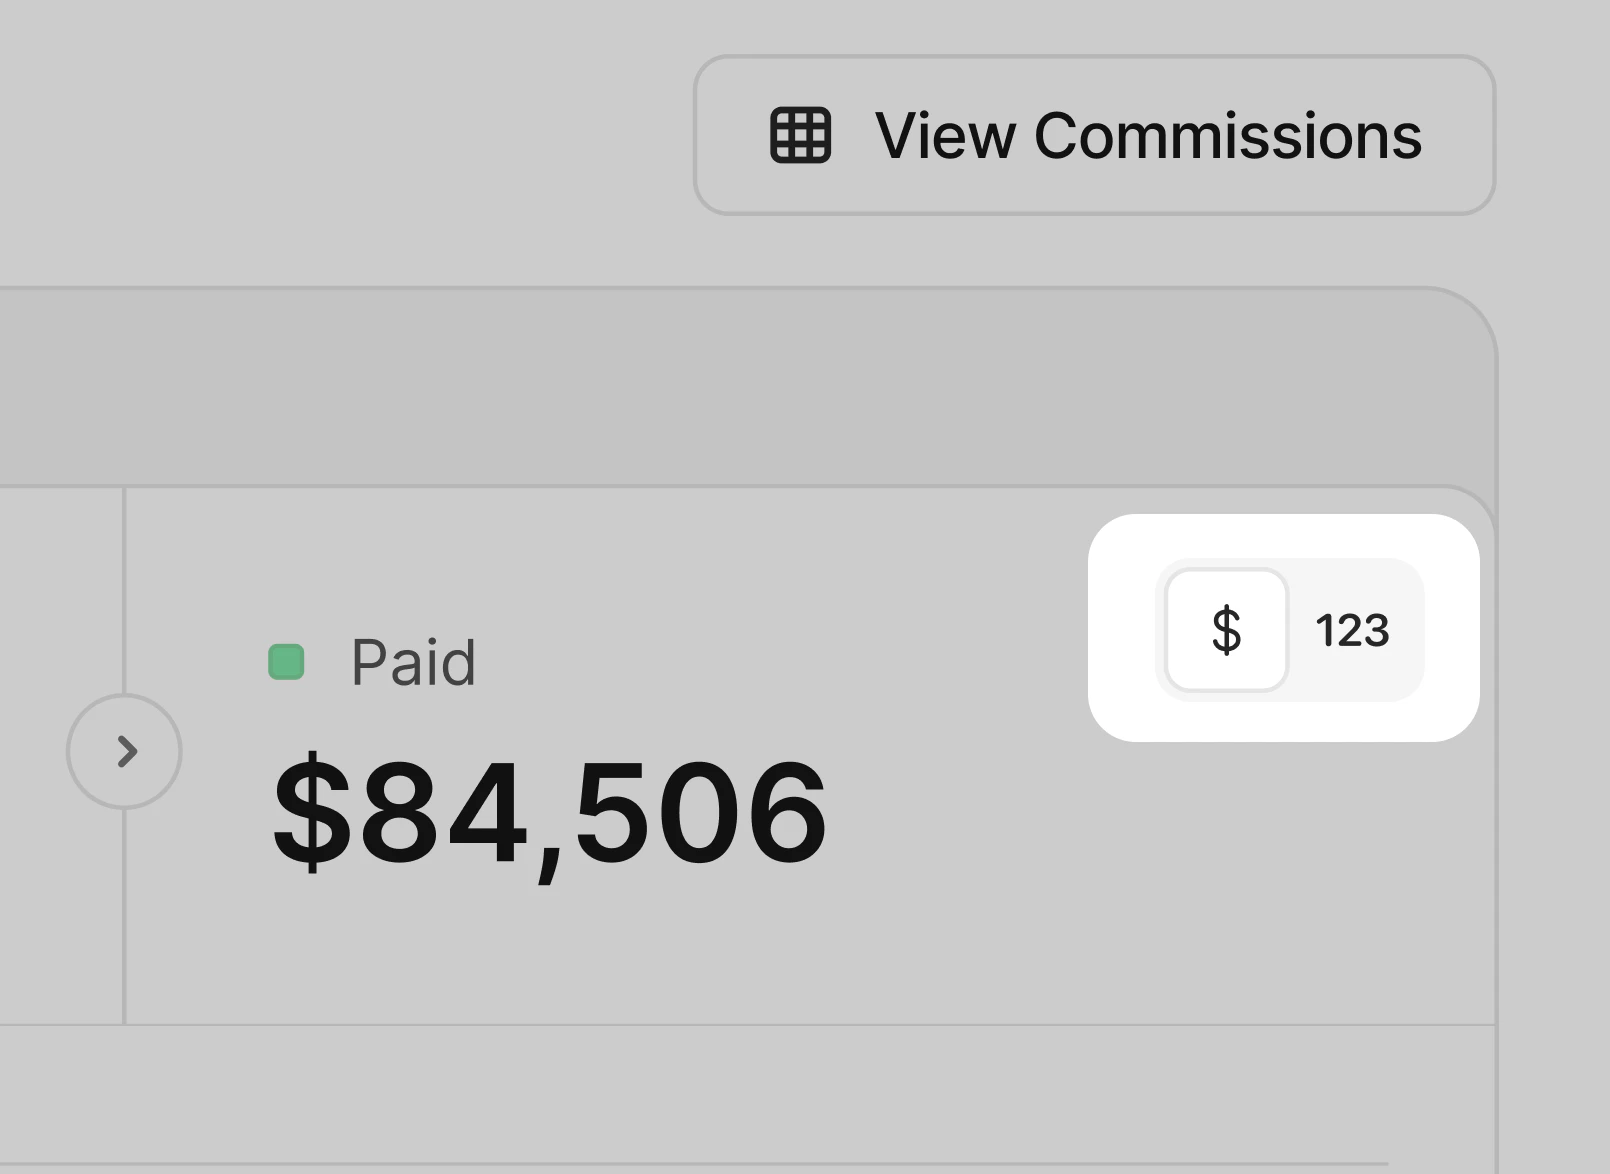 By default, `$` is selected to show commission value. Switching to `123` changes the chart to show the number of commissions instead.
### 2. Partner commission data
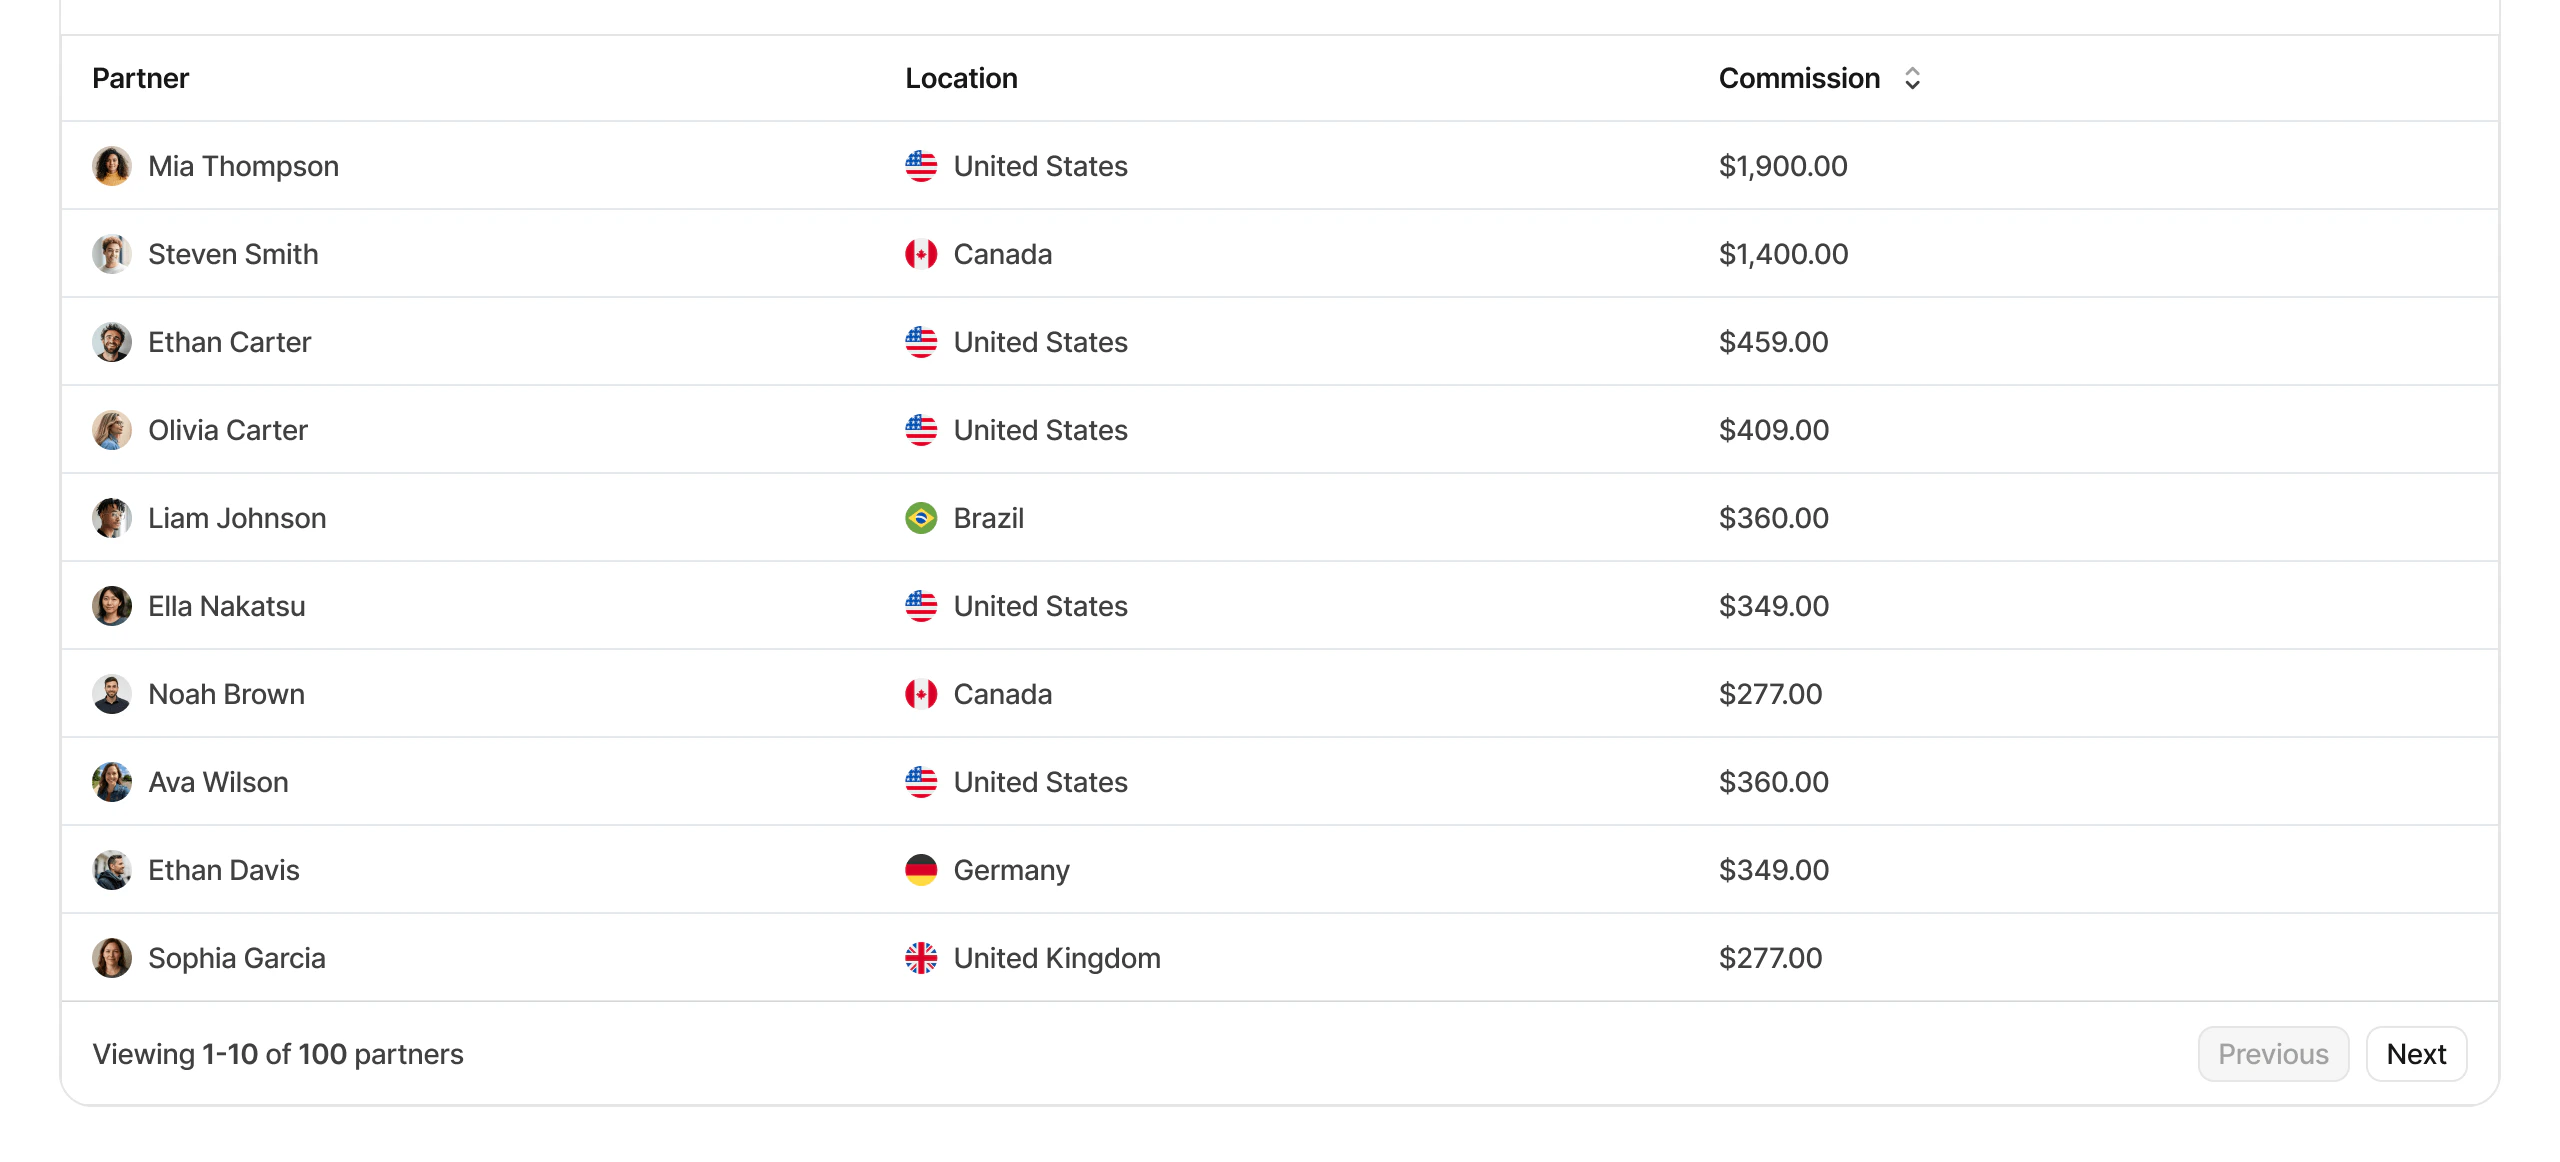
Below the chart, you can review partner-level commission performance for the selected period. This helps you identify which partners are generating the most commission activity.
By default, `$` is selected to show commission value. Switching to `123` changes the chart to show the number of commissions instead.
### 2. Partner commission data
Below the chart, you can review partner-level commission performance for the selected period. This helps you identify which partners are generating the most commission activity.
 To inspect individual commission records, go to the [Commissions page](/help/article/partner-commissions).
### 3. Aggregated data for different facets (top views)
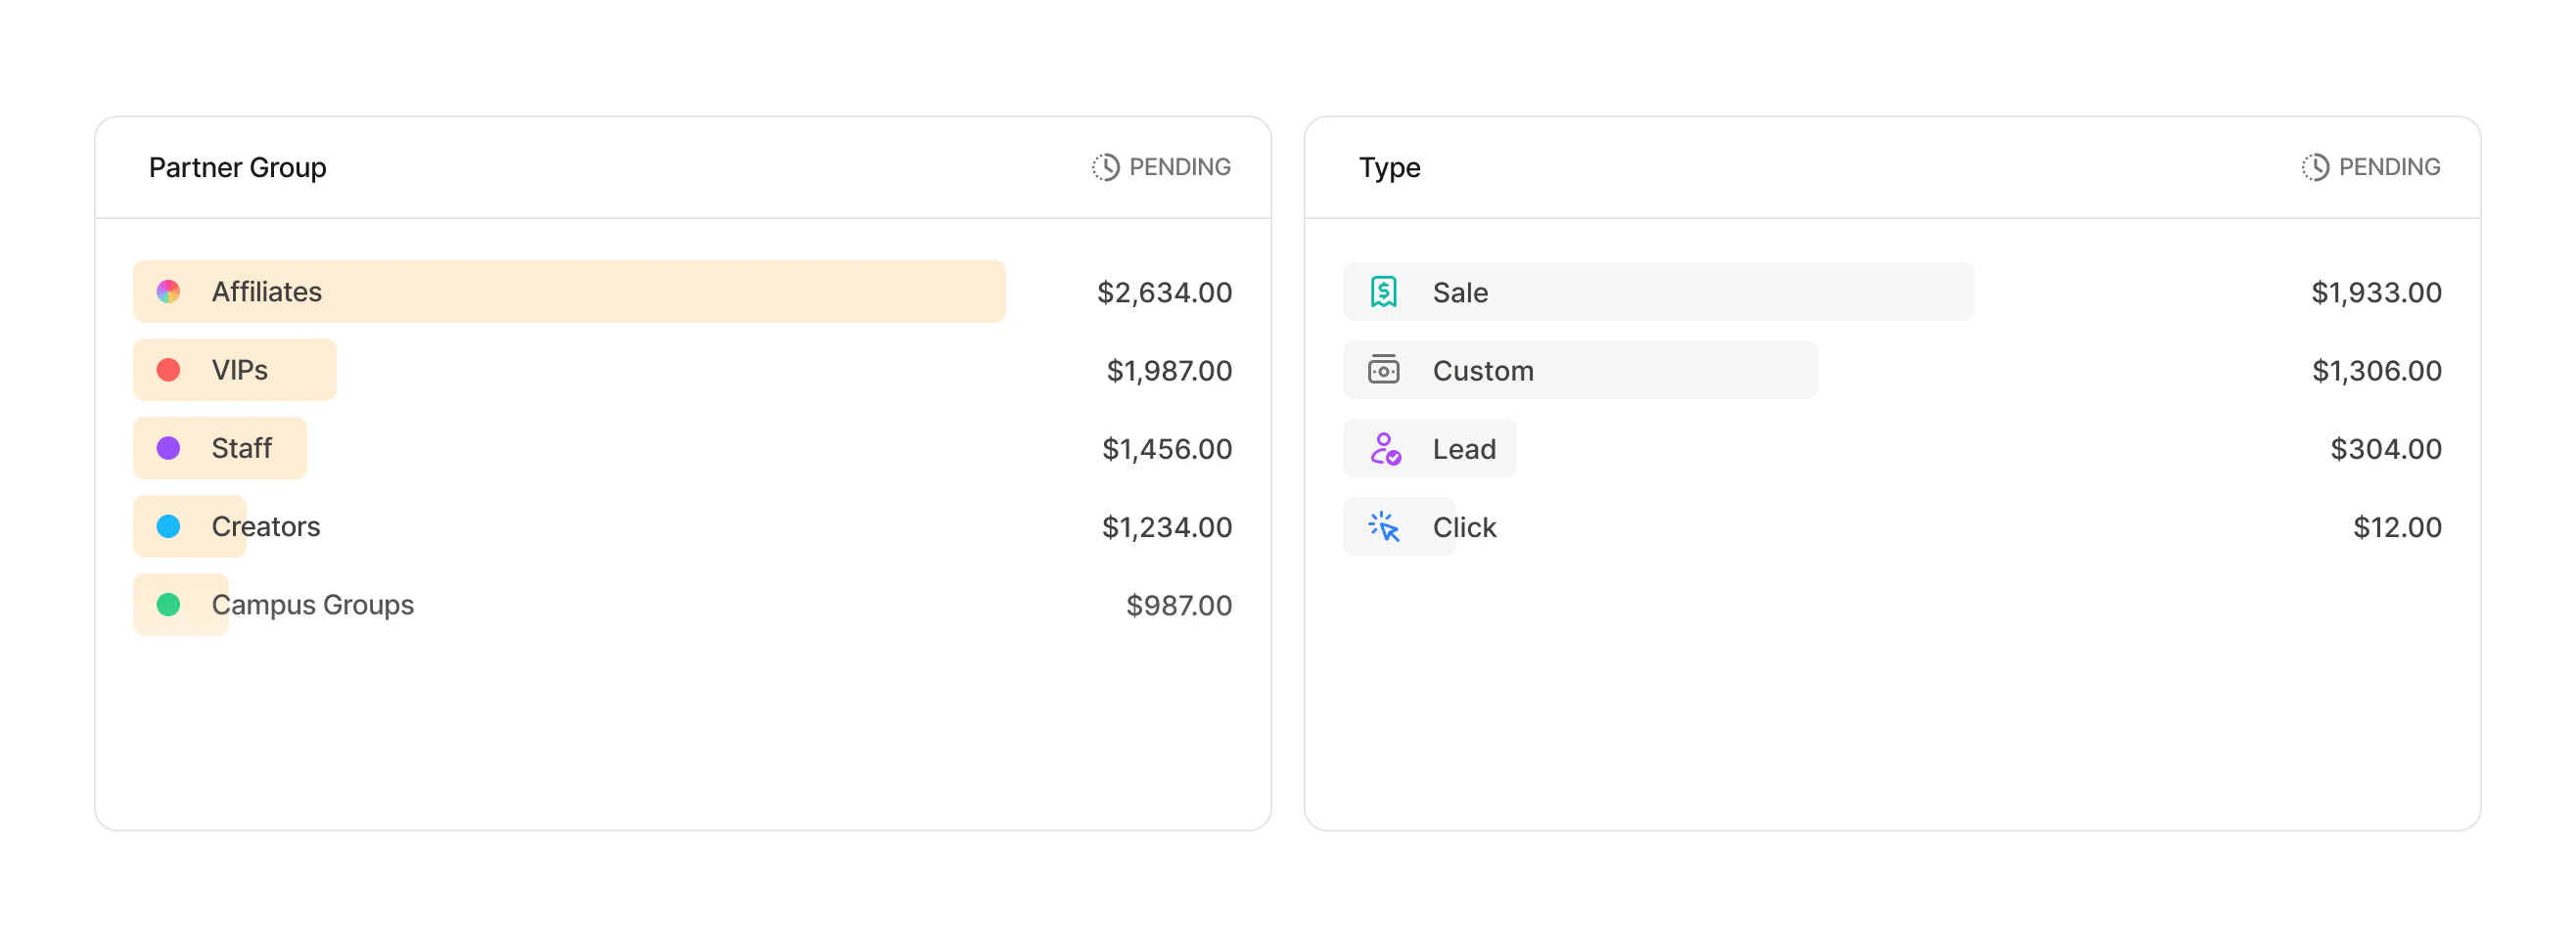
These are more commonly known as the "Top Views" in Dub Analytics. These views show your top **Partner Groups** and commission **Types**, and allow you to explore your program data further.
To inspect individual commission records, go to the [Commissions page](/help/article/partner-commissions).
### 3. Aggregated data for different facets (top views)
These are more commonly known as the "Top Views" in Dub Analytics. These views show your top **Partner Groups** and commission **Types**, and allow you to explore your program data further.
 ## Filtering commission analytics
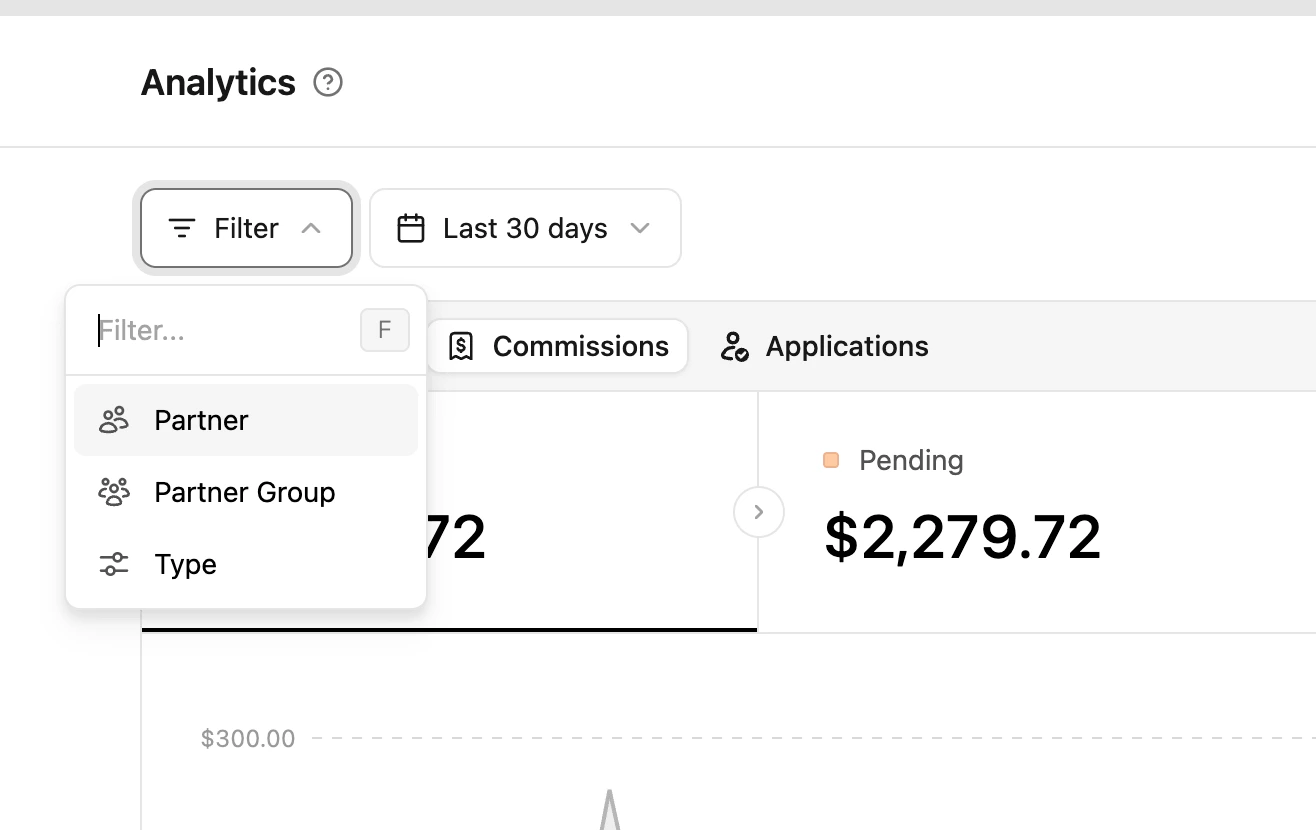
You can click the **Filter** button in the top left to narrow commission analytics by partner, group, and commission type.
The date picker controls the reporting period for the commission chart and partner data.
## Filtering commission analytics
You can click the **Filter** button in the top left to narrow commission analytics by partner, group, and commission type.
The date picker controls the reporting period for the commission chart and partner data.
 | Filter | Description |
| --------------- | --------------------------------------------------------------- |
| Partner | Select a specific program partner |
| Partner Group | Select a specific [partner group](/help/article/partner-groups) |
| Partner Tag | Select a specific [partner tag](/help/article/partner-tags) |
| Commission type | Select a specific commission type (eg: click, lead, sale) |
| Filter | Description |
| --------------- | --------------------------------------------------------------- |
| Partner | Select a specific program partner |
| Partner Group | Select a specific [partner group](/help/article/partner-groups) |
| Partner Tag | Select a specific [partner tag](/help/article/partner-tags) |
| Commission type | Select a specific commission type (eg: click, lead, sale) |